Here’s some information that may be of help on trivia night or for those of you who simply have an enquiring mind. Below are 2022’s wine production statistics measured in million hectolitres. I have included production numbers for the top 30 countries; however, the complete list is available at http://www.visualcapitalist.com. A hectolitre contains 100 litres. The information was gathered by the International Organization of Vine and Wine (OIV).
| Rank | Country | Continent | Quantity (million hl) | % of Total Production |
| 1 | Italy | Europe | 49.8 | 19.3 |
| 2 | France | Europe | 45.6 | 17.7 |
| 3 | Spain | Europe | 35.7 | 13.8 |
| 4 | United States | North America | 22.4 | 8.7 |
| 5 | Australia | Oceana | 12.7 | 4.9 |
| 6 | Chile | South America | 12.4 | 4.8 |
| 7 | Argentina | South America | 11.5 | 4.4 |
| 8 | South Africa | Africa | 10.2 | 3.9 |
| 9 | Germany | Europe | 8.9 | 3.5 |
| 10 | Portugal | Europe | 6.8 | 2.6 |
| 11 | Russia | Europe | 4.7 | 1.8 |
| 12 | China | Asia | 4.2 | 1.6 |
| 13 | New Zealand | Oceana | 3.8 | 1.5 |
| 14 | Romania | Europe | 3.8 | 1.5 |
| 15 | Brazil | South America | 3.2 | 1.2 |
| 16 | Hungary | Europe | 2.9 | 1.1 |
| 17 | Austria | Europe | 2.5 | 1.0 |
| 18 | Georga | Europe | 2.1 | 0.8 |
| 19 | Greece | Europe | 2.1 | 0.8 |
| 20 | Moldova | Europe | 1.4 | 0.5 |
| 21 | Switzerland | Europe | 1.0 | 0.4 |
| 22 | North Macedonia | Europe | 0.9 | 0.4 |
| 23 | Japan | Asia | 0.8 | 0.3 |
| 24 | Peru | South America | 0.8 | 0.3 |
| 25 | Uruguay | South America | 0.8 | 0.3 |
| 26 | Bulgaria | Europe | 0.7 | 0.3 |
| 27 | Canada | North America | 0.7 | 0.3 |
| 28 | Ukraine | Europe | 0.7 | 0.3 |
| 29 | Türkiye | Europe | 0.6 | 0.2 |
| 30 | Czech Republic | Europe | 0.6 | 0.2 |
Just for fun I did some number crunching to determine the ratio of world production by continent. Because I rounded the individual country totals the overall total percentage added up to 101%, not 100. However, the continental totals will give you a fairly accurate perspective of world wine production.
| Rank | Continent | Quantity (million hl) | % of Total Production |
| 1 | Europe | 172,706 | 67 |
| 2 | South America | 28,661 | 11 |
| 3 | North America | 23,473 | 9 |
| 4 | Oceana | 16,575 | 6 |
| 5 | Africa | 11,136 | 4 |
| 6 | Asia | 7,307 | 3 |
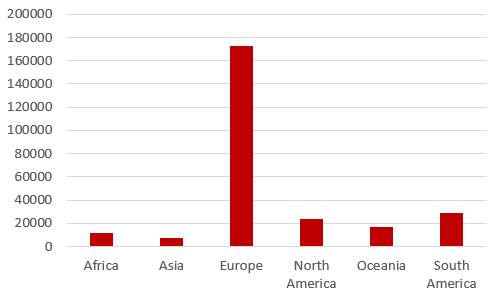
It is incredible that Europe controls two thirds of the world’s wine production. I was surprised to see that overall, North America’s wine production was greater than Oceana (Australia and New Zealand),and was very surprised to see that Canada’s production was ranked as only 27th. I imagined it would be somewhere closer to that of Hungary and Greece. However, quality outranks quantity. It would be interesting to know whether a quality scale could ever be devised to compare countries..
Sláinte mhaith

Thanks- very informative and well presented.
Now- I’m thirsty!!
Cheers 🥂
Sent from my iPhone
LikeLike
Hi Peter,
We’re in Switzerland right now boarding a river cruise starting tomorrow. Glad to hear that the article posted ok.
Dave
LikeLike